一、简介
radare2和frida的结合体,多用于native代码的hook和调试。参考:https://github.com/nowsecure/r2frida
二、安装
- 先安装radare2, 参考https://github.com/radareorg/radare2
- r2pm -ci r2frida
三、使用
这里列举常用的命令,更详细操作参考r2wiki https://r2wiki.readthedocs.io/en/latest/radare-plugins/frida/
1. 用r2frida开启调试
现在搜到的教程一般是较老的使用方式,运行r2 “frida://?”查看最新使用方法:
分为local、usb和remote三种: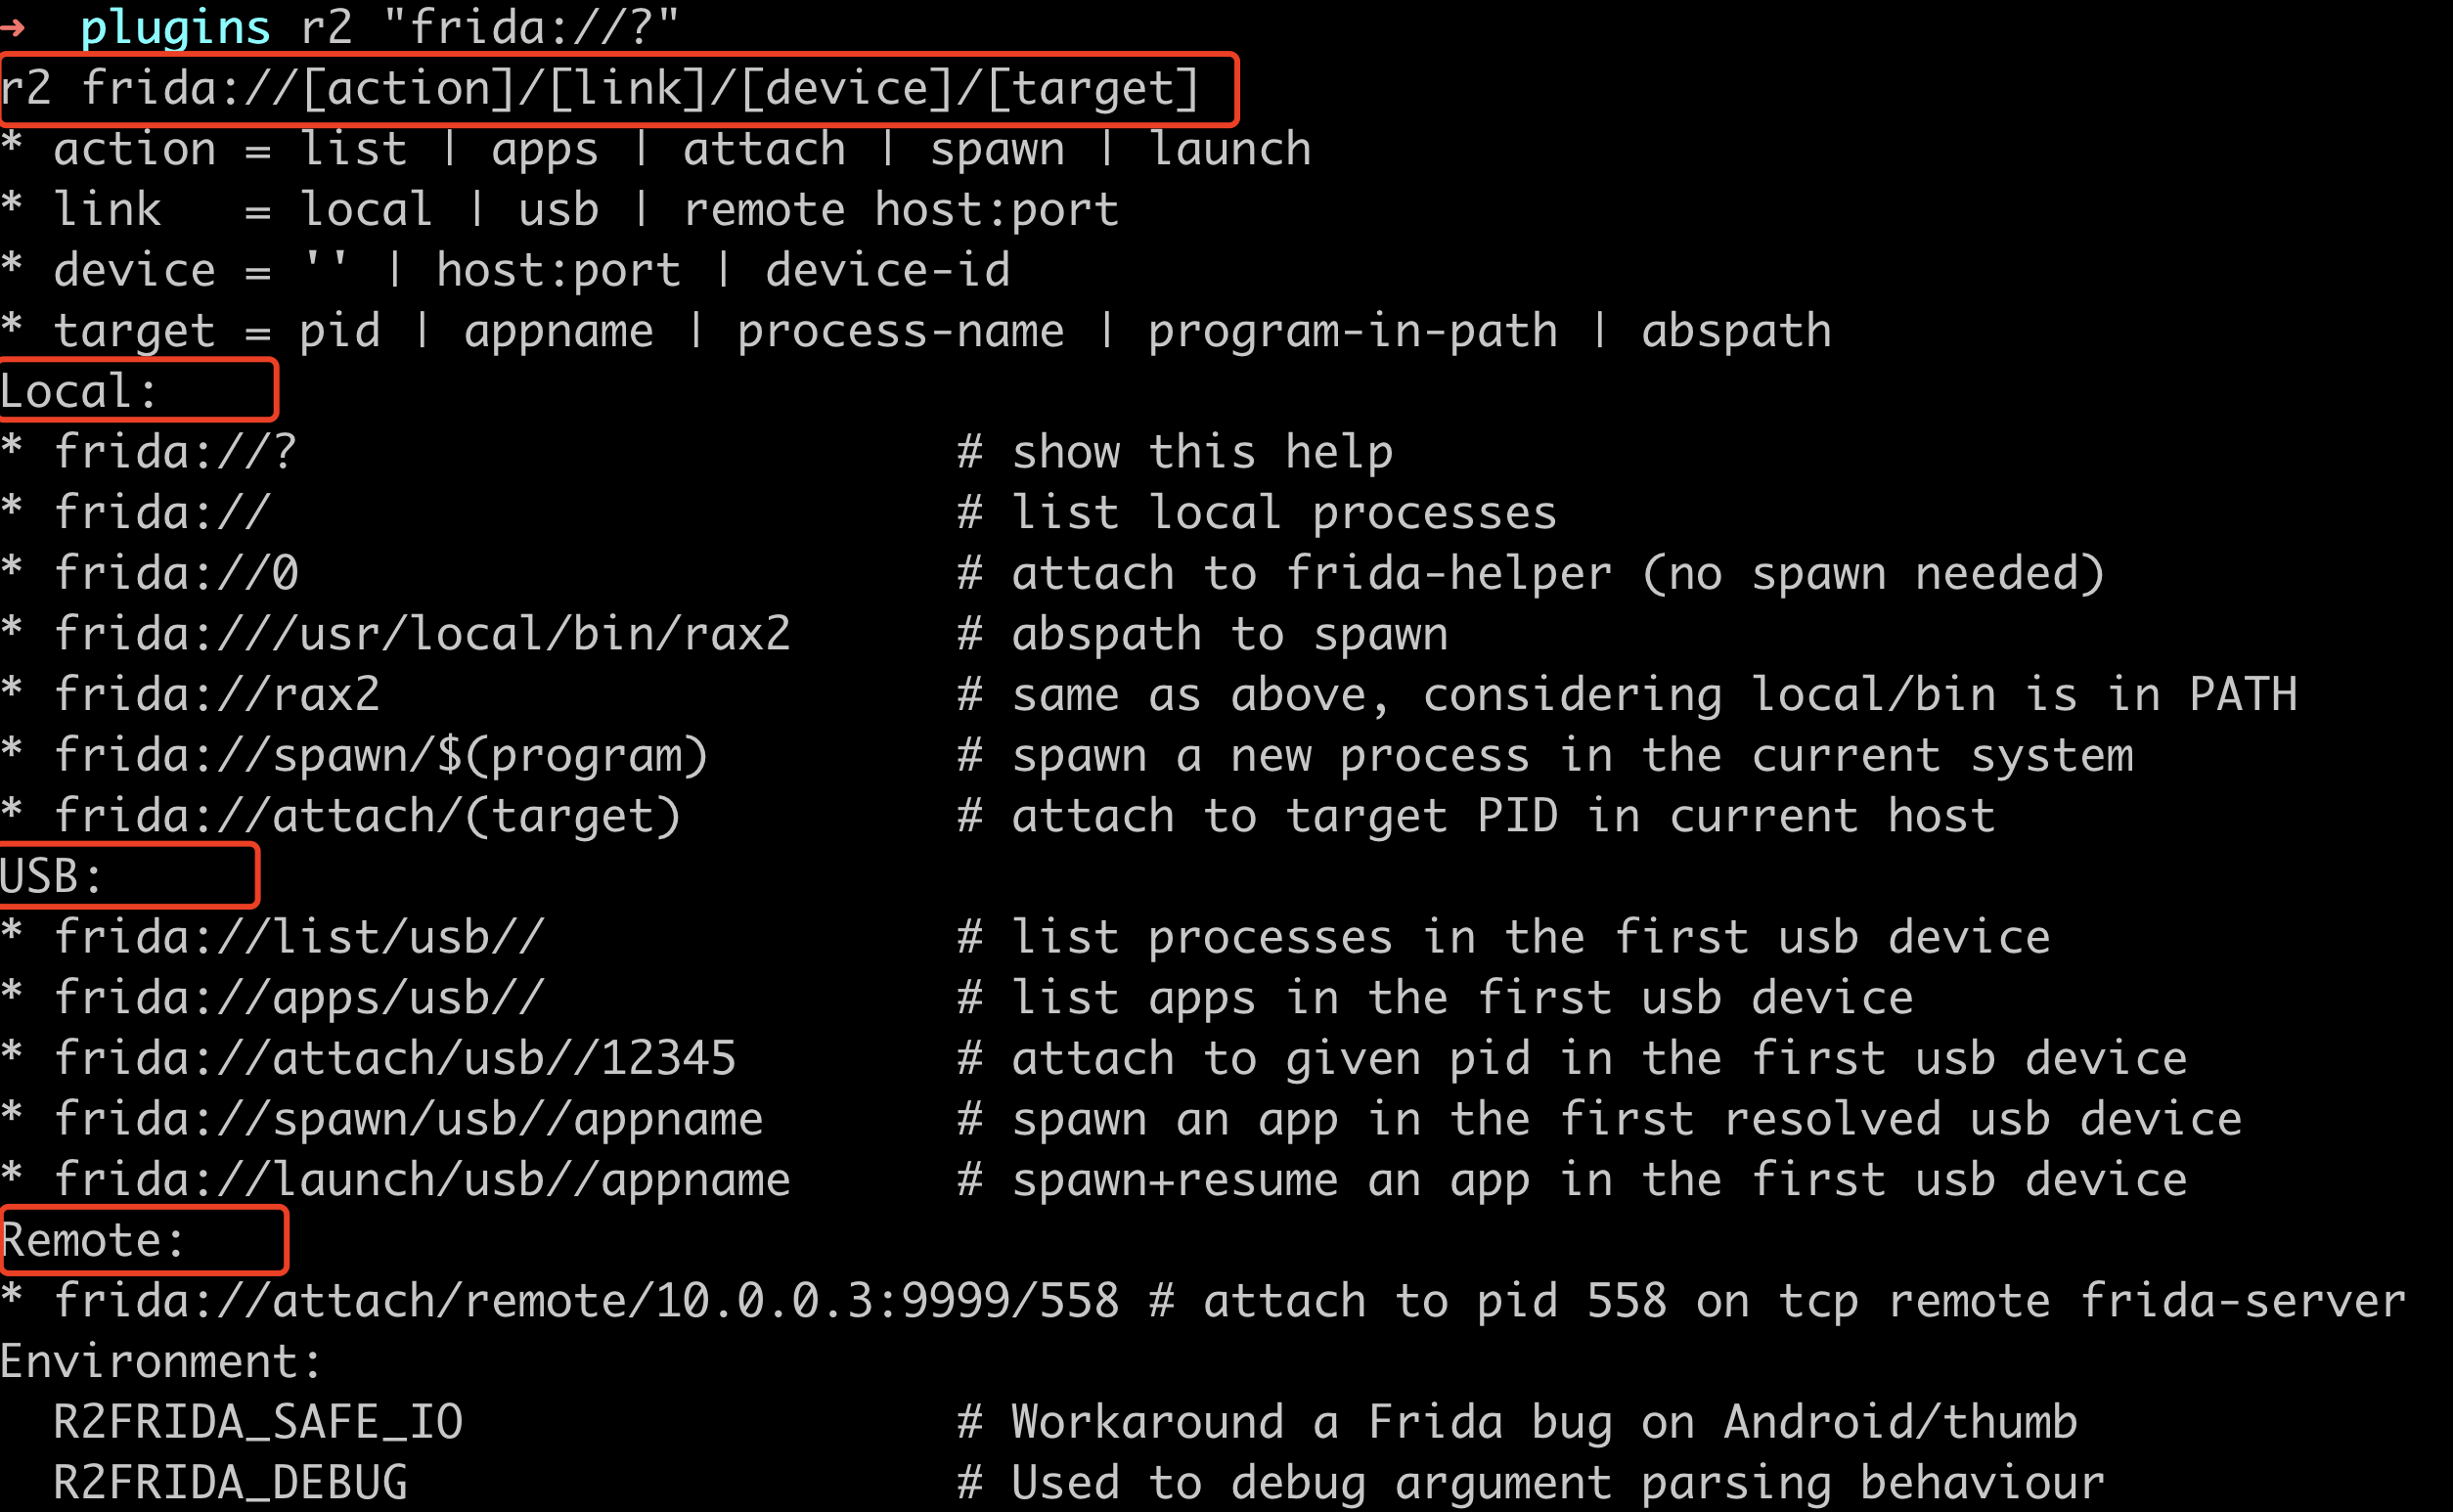
调试手机的APP,这里使用:
- spawn模式
1
r2 frida://spawn/usb//com.tencent.mm
使用spawn模式,需要运行”\dc“实现进程resume(r2frida命令以 =! 或 \ 为前缀,后边加问号可以查看命令帮助,例如\?,=!?, dc表示continue断点或resume进程)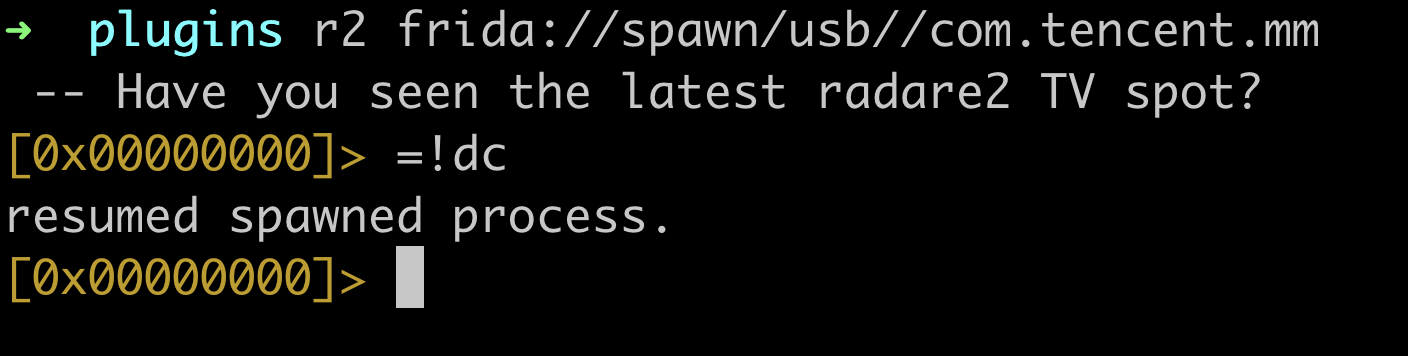
- attach模式
1
r2 frida://attach/usb//com.tencent.mm
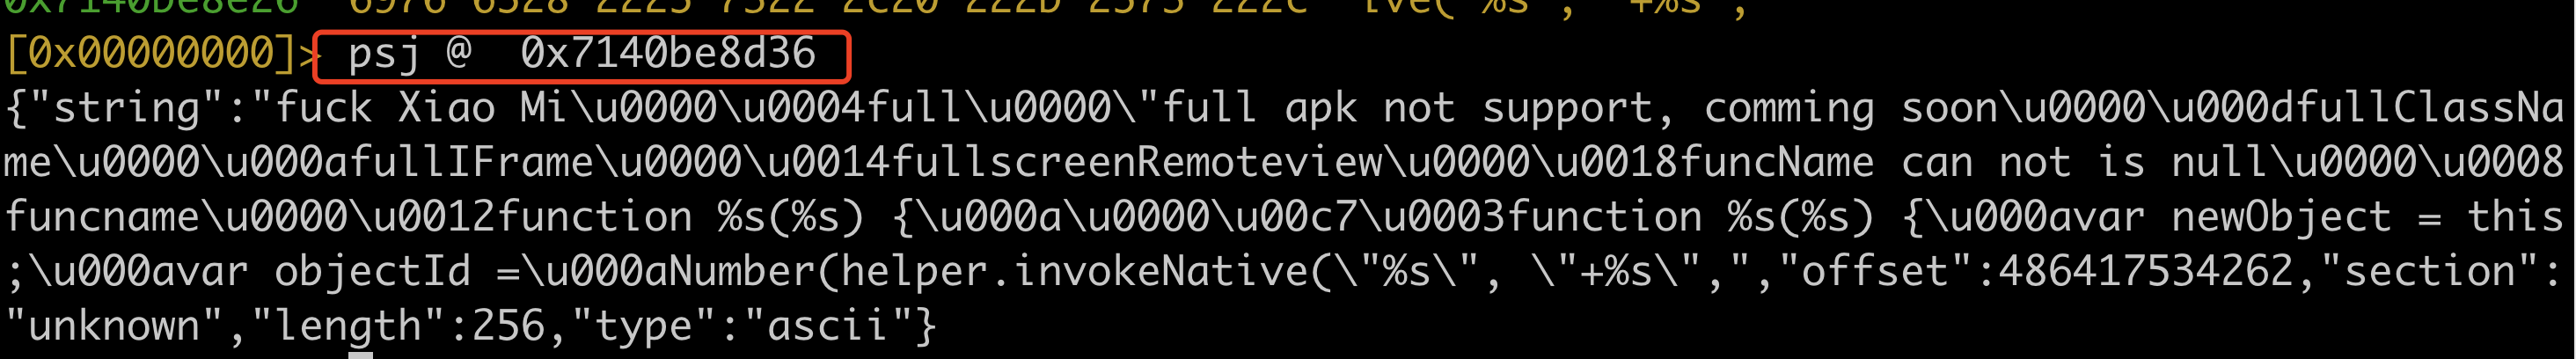
2. 内存搜索
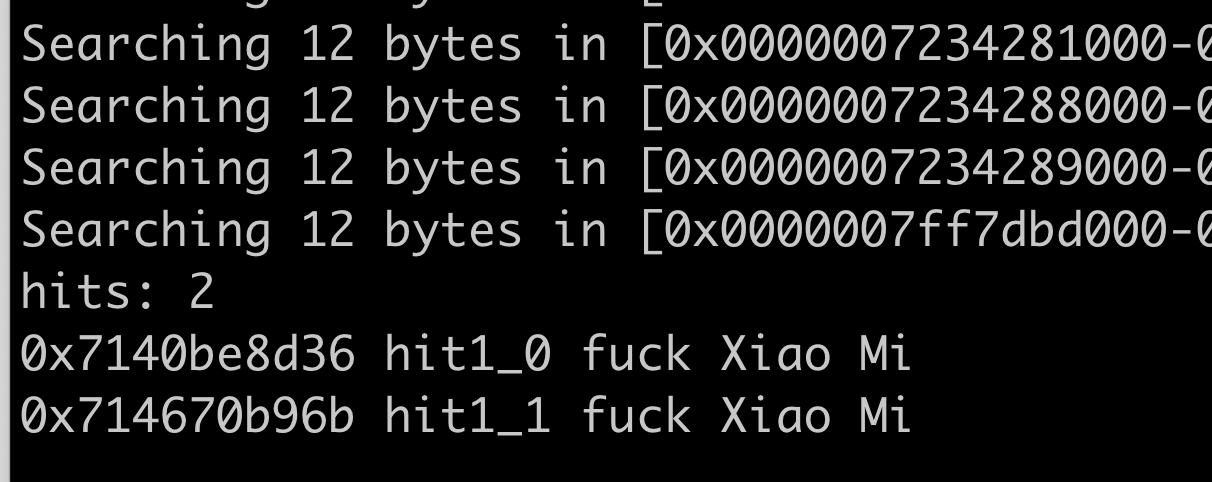
1 | \/ keyword (注意有空格) |
- 例如在微信进程搜索”\/ fuck Xiao Mi“
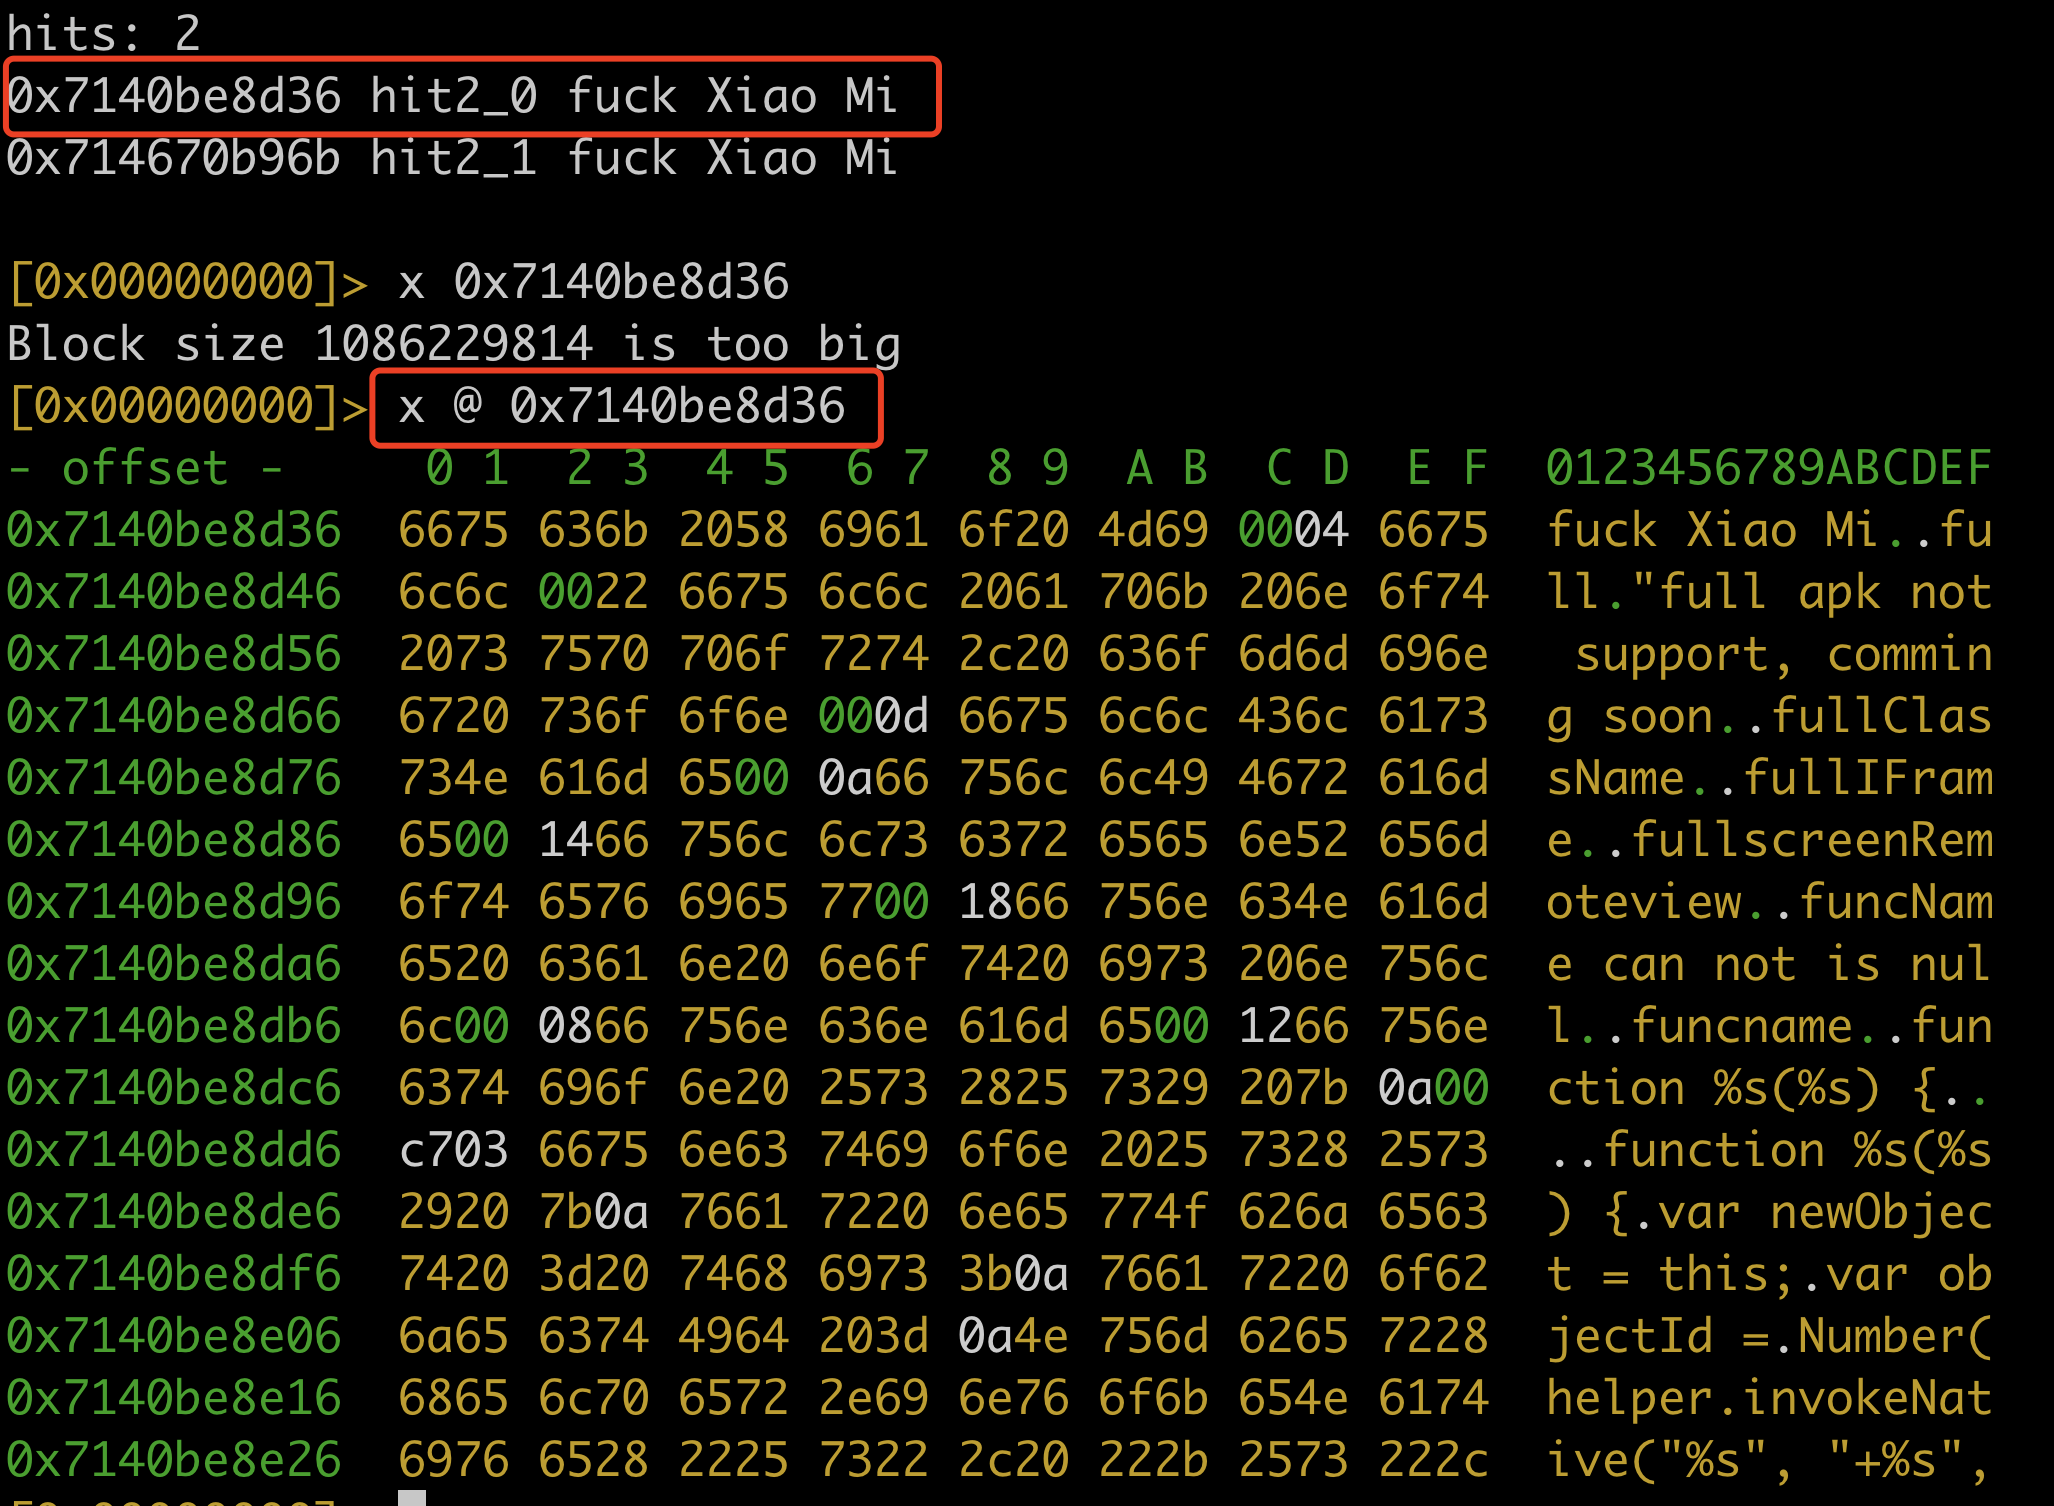
- 查看内存具体位置
1
x @ 地址 (x 是 px 命令的简写,这个命令作用是show hexdump)
- 格式化输出
3. d
d应dynamic的意思,主要实现动态调试的功能,常见的命令如下:1
2
3
4
5
6
7
8
9
10
11
12
13
14
15
16
17
18
19
20
21
22
23
24
25
26
27
28
29
30
31
32
33
34
35
36
37
38d. Start the chrome tools debugger
db (<addr>|<sym>) List or place breakpoint
db- (<addr>|<sym>)|* Remove breakpoint(s)
dc Continue breakpoints or resume a spawned process
dd[j-][fd] ([newfd]) List, dup2 or close filedescriptors (ddj for JSON)
di[0,1,-1] [addr] Intercept and replace return value of address
dk ([pid]) [sig] Send specific signal to specific pid in the remote system
dkr Print the crash report (if the app has crashed)
dl libname Dlopen a library (Android see chcon)
dl2 libname [main] Inject library using Frida's >= 8.2 new API
dlf path Load a Framework Bundle (iOS) given its path
dlf- path Unload a Framework Bundle (iOS) given its path
dm[.|j|*] Show memory regions
dma <size> Allocate <size> bytes on the heap, address is returned
dma- (<addr>...) Kill the allocations at <addr> (or all of them without param)
dmad <addr> <size> Allocate <size> bytes on the heap, copy contents from <addr>
dmal List live heap allocations created with dma[s]
dmas <string> Allocate a string initiated with <string> on the heap
dmh List all heap allocated chunks
dmh* Export heap chunks and regions as r2 flags
dmhj List all heap allocated chunks in JSON
dmhm Show which maps are used to allocate heap chunks
dmm List all named squashed maps
dmp <addr> <size> <perms> Change page at <address> with <size>, protection <perms> (rwx)
dp Show current pid
dpt Show threads
dr Show thread registers (see dpt)
dt (<addr>|<sym>) .. Trace list of addresses or symbols
dt- (<addr>|<sym>) Clear trace
dt-* Clear all tracing
dt. Trace at current offset
dtf <addr> [fmt] Trace address with format (^ixzO) (see dtf?)
dth (addr|sym)(x:0 y:1 ..) Define function header (z=str,i=int,v=hex barray,s=barray)
dtl[-*] [msg] debug trace log console, useful to .\T*
dtr <addr> (<regs>...) Trace register values
dts[*j] seconds Trace all threads for given seconds using the stalker
dtsf[*j] [sym|addr] Trace address or symbol using the stalker (Frida >= 10.3.13)
dxc [sym|addr] [args..] Call the target symbol with given args
- \db 地址或符号 打断点
- \db- 地址或符号 取消断点
- \dc 继续运行
- \dm 列出内存maps
- \dm~keyword 匹配关键字
- \dma 10 分配特定大小的内存
- \dmas xxxx 堆上分配字符串
- \dp 显示进程号
\dpt 显示线程
\dt addr 跟踪某个地址调用
- \dtr addr 跟踪地址调用,并输出寄存器信息
\dtf addr format 跟踪地址调用,并输出调用栈、字符、onEnter、onExit等
1
2
3
4
5
6
7
Usage: dtf [format] || dtf [addr] [fmt]
^ = trace onEnter instead of onExit
+ = show backtrace on trace
x = show hexadecimal argument
i = show decimal argument
z = show pointer to string
O = show pointer to ObjC object\dxc 调用指定函数,需要提供参数
1
2
3
例如
\dxc write 1 "hello\n" 6
write参数列表(int fd, const void *buf, size_t count);
4. i
i应该是info的意思,主要是显示一些静态的分析结果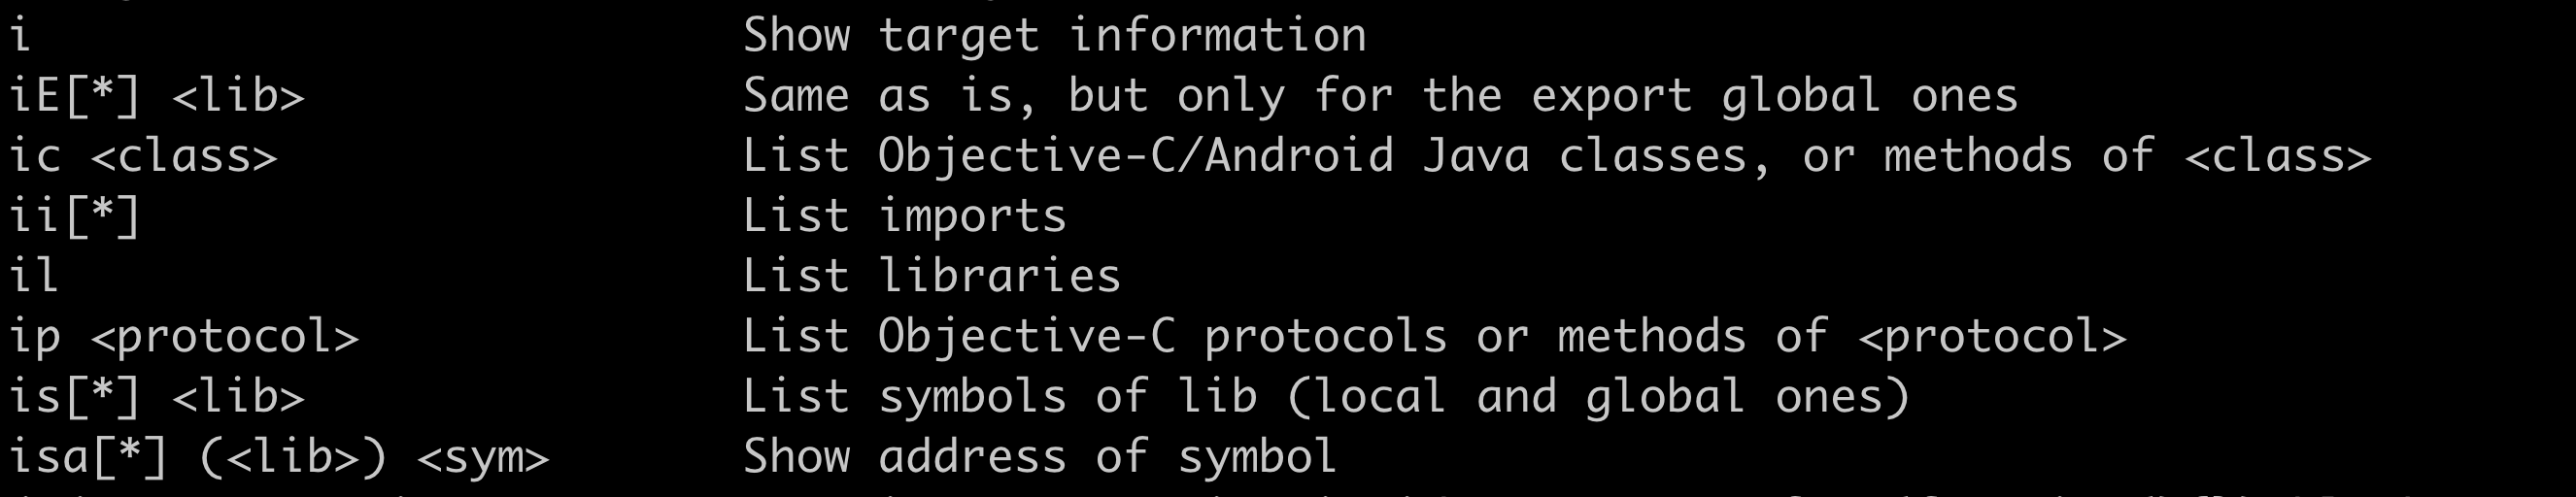
- \i dump基本信息
- \il 列出所有的modules
- \ilj 以json格式列出modules
- \iE modulename 列出某个module的导出表
- \ii modulename 列出某个module的导入表
- \ic classname 列出某个累的所有函数
5. w
w应该是write,写入操作
- w string @0xfffff 向指定地址写入字符串
- wx 0xff @0xe9322cca 写入二进制字节
- w0 5 @0xe9322cca 写入5个字节0