远程调试
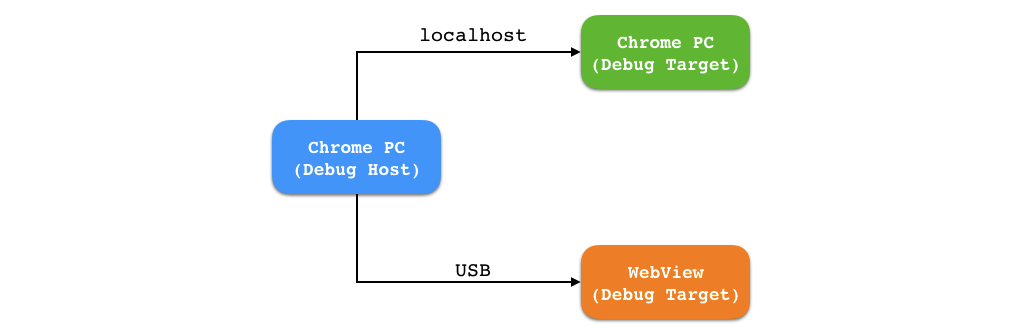
Chrome的调试目标主要分两种:Chrome PC 浏览器和 Chrome Mobile
调试PC端chrome
除了使用“审查元素”外,还可以用一个进程的chrome调试另一个进程的chrome。利用命令行启动chrome,并开启调试端口即可:1
sudo /Applications/Google\ Chrome.app/Contents/MacOS/Google\ Chrome --remote-debugging-port=2333
需要注意被调试端暴露的端口只接受来自127.0.0.1 或者localhost 的端口请求。
调试Android端chrome
调试Android端Chrome需要:
- adb连接(USB线连接或adb网络调试)
- 手机端webview需要打开调试模式
1
webview.setWebContentsDebuggingEnabled(true)
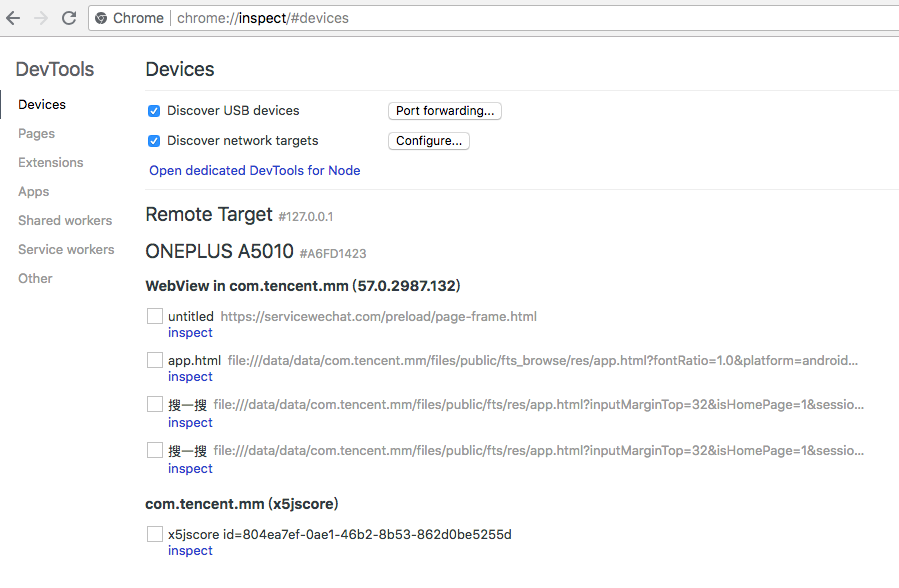
满足上述2点后,在PC上的chrome中输入chrome://inspect或about://inspect,即可进入调试界面。
调试实现
Chrome的调试本质上通过端口来实现,PC端chrome在开启调试模式时会指定端口,Android端通过adb forward来实现:1
adb forward tcp:2333 localabstract:webview_devtools_remote_6784
被调试的webview在手机上创建一个Unix Domain Socket, 这个socket的名字为 webview_devtoolsremote
Unix Domain Socket转发到PC上一个本地端口,进而实现了调试。
调试权限
Google 为了限制调试端口的接入范围,对于 Chrome PC 浏览器,调试端口只接受来自 127.0.0.1 或者 localhost 的数据请求,所以,无法通过你的本地机器 IP 来调试 Chrome。
对于 Android Chrome/WebView,调试端口只接受来自于 shell 这个用户数据请求,也就是说只能通过 USB 进行调试,或者通过adb网络连接调试。
为了测试这一点,我们通过本地socket连接Unix Domain Socket进行了实验验证:1
2
3
4
5
6
7
8
9
10
11
12
13
14
15
16
17
18
19
20
21
22
23
24
25
26
27
28
29
30
31
32
33
34
35
36
37
38
39
40
41
42
43
44
45
46
47
48
49
50#include <stdio.h>
#include <string.h>
#include <stddef.h>
#include <sys/un.h>
#include <sys/socket.h>
void send_remote_request(char *msg)
{
int localsocket, len;
struct sockaddr_un remote;
if ((localsocket = socket(AF_UNIX, SOCK_STREAM, 0)) == -1) {
exit(1);
}
char *name="webview_devtools_remote_6784";//与java上层相同哦
remote.sun_path[0] = '\0'; /* abstract namespace */
strcpy(remote.sun_path+1, name);
remote.sun_family = AF_UNIX;
int nameLen = strlen(name);
len = 1 + nameLen + offsetof(struct sockaddr_un, sun_path);
if (connect(localsocket, (struct sockaddr *)&remote, len) == -1) {
printf("connect error\n");
return;
}
if (send(localsocket, msg, strlen(msg),0) == -1) {
printf("send error\n");
return;
}
char buf[1024];
if (recv(localsocket,buf,1024, 0) == -1){
printf("rece error\n");
return;
}
printf("received: %s",buf);
close(localsocket);
}
int main()
{
char *http="GET /json/version HTTP/1.1\r\nHost: 127.0.0.1\r\nUser-Agent: curl/7.54.0\r\nAccept: */*\r\n\r\n";
send_remote_request(http);
}
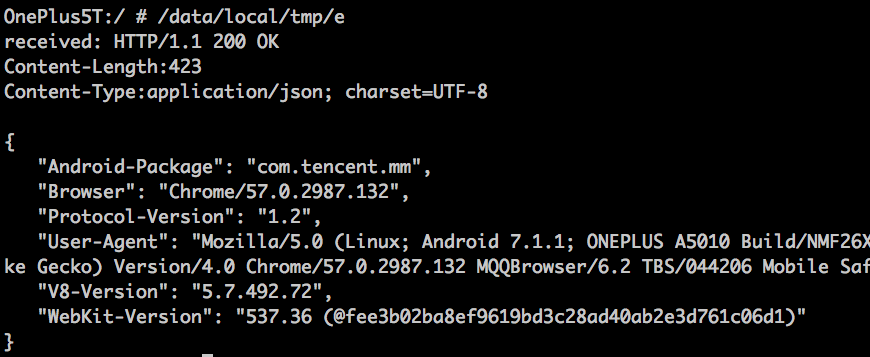
上述代码编译的程序在uid=0(root权限)运行时,会受到返回socket数据:
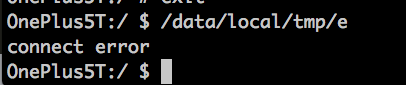
在其他权限执行时,socket会连接错误:
请求调试端口
通过以上的调试方式的接入以及调试端口的打开,这个时候在浏览器中请求127.0.0.1:2333,可以看到以下内容:1
2
3
4
5
6
7
8
9
10[ {
"description": "{\"attached\":true,\"empty\":false,\"height\":1055,\"screenX\":0,\"screenY\":210,\"visible\":true,\"width\":845}",
"devtoolsFrontendUrl": "http://chrome-devtools-frontend.appspot.com/serve_rev/@8daf58f7f40d22013c59388236c8e71e1117cb2c/inspector.html?ws=127.0.0.1:2333/devtools/page/0F8BF00855E9F57A1D62802C1882DE05",
"faviconUrl": "http://mat1.gtimg.com/www/icon/favicon2.ico",
"id": "0F8BF00855E9F57A1D62802C1882DE05",
"title": "腾讯首页",
"type": "page",
"url": "http://www.qq.com/",
"webSocketDebuggerUrl": "ws://127.0.0.1:2333/devtools/page/0F8BF00855E9F57A1D62802C1882DE05"
} ]
其中,最重要的 2 个参数分别是 id 和 webSocketDebuggerUrl。
Chrome 会为每个页面分配一个唯一的 id,作为该页面的唯一标识符。几乎对目标浏览器的所有操作都是需要带上这个 id。
webSocketDebuggerUrl 则在调试该页面需要用到的一个 WebSocket 连接。chrome 的 devtool 的所有调试功能,都是基于 Remote Debugging Protocol 使用 WebSocket 来进行数据传输的。每一个页面都有自己不同的 webSocketDebuggerUrl。这个 webSocketDebuggerUrl是通过 url 的 query 参数传递给 chrome devtool 的。
chrome 的 devtool 可以从 Chrome 浏览器中进行提取 devtool 源码或者从 blink 源码中获取。在部署好自己的 chrome devtool 代码之后,下面既可以开始对 Chrome 进行调试, 浏览器输入以下内容:1
http://path_to_your_devtool/devtool.html?ws=127.0.0.1:2333/devtools/page/0F8BF00855E9F57A1D62802C1882DE05
Chrome 提供了以下这些 http 接口控制目标浏览器:1
2
3
4
5
6
7
8
9
10
11# 获取当前所有可调式页面信息
http://127.0.0.1:9222/json
# 获取调试目标 WebView/blink 的版本号
http://127.0.0.1:9222/json/version
# 创建新的 tab,并加载 url
http://127.0.0.1:9222/json/new?url
# 关闭 id 对应的 tab
http://127.0.0.1:9222/json/close/id
Chrome Android远程调试诊断
通过chrome://inspect调试webview出现404
可能问题:
PC端的chrome比手机端版本新,使用inspect feedback可解;
如果没有inspect feedback,使用旧版本的Chrome调试;
使用离线的第三方工具包调试,参考https://www.cnblogs.com/slmk/p/7591126.html
其他参考链接:
1.https://www.cnblogs.com/slmk/p/9832081.html
2.https://stackoverflow.com/questions/51519636/google-chrome-developer-tools-android-debugging-returns-http-1-1-404-not-found
3.https://bugs.chromium.org/p/chromium/issues/detail?id=853525&can=8&q=&colspec=ID%20Pri%20M%20Stars%20ReleaseBlock%20Component%20Status%20Owner%20Summary%20OS%20Modified
是否开启了unix domain socket
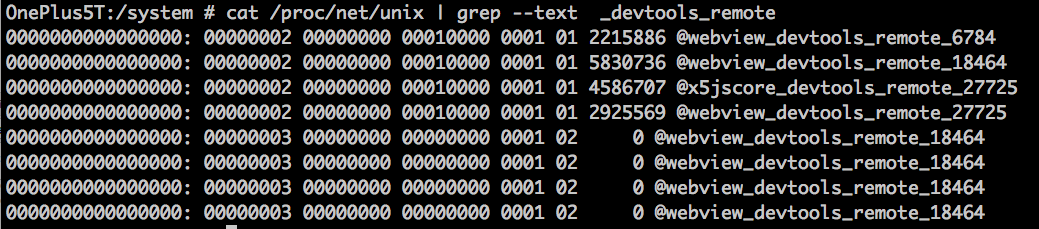
运行下列命令,如果查到abstract socket:@chrome_devtools_remote,则表明chrome for android 开启了unix domain socket。如果查到abstract socket@webview_devtools_remote_27594,则说明了AndroidWebView也开启了unix domain socket1
cat /proc/net/unix | grep --text _devtools_remote
是否开启了websocket服务器
可以通过ptyhon库websocket-client来测试.1
2
3
4
5
6
7
8
9$ sudo pip install websocket-client
python
>>> import websocket
>>> ws = websocket.create_connection("ws://localhost:4000/devtools/page/140")
>>> ws.send("Hello,world")
17
>>> result = ws.recv()
>>> print result
{"error":{"code":-32700,"message":"Message must be in JSON format"},"id":null}
参考资料:
- 揭秘浏览器远程调试技术 http://taobaofed.org/blog/2016/10/19/chrome-remote-debugging-technics/
- Chrome for Android Remote Inspector 原理 https://blog.csdn.net/xxhforest/article/details/52204197
- LocalServerSocket https://developer.android.com/reference/android/net/LocalServerSocket
- Linux下进程间通讯方式 - UNIX Domain Socket https://blog.csdn.net/z2066411585/article/details/78966434/